01.09.2021 -- #
Since I started my 300 litre aquarium last January I’ve been periodicity testing the water; mostly with home test kits but I’ve also sent in two ICP analysis. The observation notes were in emacs using org mode but recently I’ve wanted a summery view of the data with graphs. I decided to come out of free text land to something more structured and rewrote the notes into yaml.
My partner is in data analytics field. I’m aware of the vast expanse of data tools and languages such as R, Python, Jupiter Notebooks… but, working professionally everyday in frontend technologies I thought it would be faster do build something custom with React + Redux Toolkit. I uploaded the yaml file to s3, which is publicly exposed via cloudfront same as this site, then set about using redux toolkit rtf query to fetch the observations and load then into redux state. After a few hours I got stuck trying to mix local component state, useState, with the redux state and had react re-rendering issues. Wow the frontend space is getting complex these days. In frustration I started looking for another approach.
screenshot
What was that JavaScript Notebook service I created an account last year then didn’t make anything? … Oh yeah! Observable.
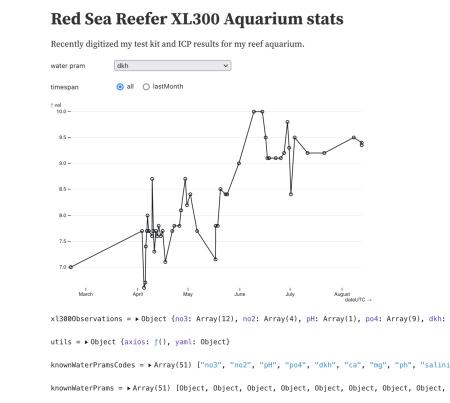
With Observable I was able to reuse a the JS I just wrote, importing axios and js-yaml seamlessly. Then using their builtin plot library I was pretty quickly able to make the visualisation and worked in basic interactivity to select water parameter and time window using their viewof functionality. Turned out to be way easier and faster then rolling my own tool. I would highly recommend trying it out for similar use cases.